Adding your own Strategy
From a research and practical perspective, it is important to allow users to add their own strategies and compare with the existing state of the art.
We have provided a template file (\Strategies\template.m), which can be used to design and code new strategies. The template file looks like this:
We have provided a template file (\Strategies\template.m), which can be used to design and code new strategies. The template file looks like this:
function [ cum_ret, cumprod_ret, daily_ret, daily_portfolio] = template( fid, data, varargins, opts )
% This is a template for writing a portfolio selection algorithm
%
% [ cum_ret, cumprod_ret, daily_ret, daily_portfolio] = template( fid, data, varargins, opts )
%
% Please put the description of your algorithm here
% Name of Strategy:
% Author:
% Description:
% The sections labelled as "Static" of the file need not be changed
%%%%%%%%%%%%%%%%%%%%%%%%%%%%%%%%%%%%%%%%%%%%%%%%%%%%%%%%%%%%%%%%%%%%%%%%%%%
% This file is part of OLPS: http://OLPS.stevenhoi.org/
% Original authors:
% Contributors:
% Change log:
%
%%%%%%%%%%%%%%%%%%%%%%%%%%%%%%%%%%%%%%%%%%%%%%%%%%%%%%%%%%%%%%%%%%%%%%%%%%%
%% Make changes to this section to construct your algorithm
%% Read Parameters
p1 = varargins{1};
%% Initialize variables
[r c] = size(data);
b = ones(c,1)/c;
returns = zeros(r,1);
portfolio = ones(r,c)/c;
%% Static
progress = waitbar(0,'Executing Algorithm...');
%% The looping over the entire dataset for backtesting
% The algorithm looping over r time periods
for t = 1:1:r
%% Static
% compute x ofthe optimization problem i.e. todaysRelative
todaysRelative = data(t,:)';
% Compute the returns of algorithm
portfolio(t, :) = b;
returns(t) = b'*(todaysRelative-1);
%% Change this section to describe your strategy portfolio selection method
% Use solver/algorithm to find new portfolio vector at end of time
% period t
%% Static
% Update Progress
if mod(t, 50) == 0
waitbar((t/r));
end
end
%% Static
% Compute additional statistics (for quick individual run without GUI)
% Can be deleted
stats.finalValue = prod(returns+1);
Y =r/252;
stats.sharpe = ((stats.finalValue)^(1/Y) - 1.04) / (std(returns)*sqrt(252));
stats.averageInTopStock = mean(max(portfolio') );
stats.averageInTop2Stocks = flipud(sort(portfolio'));
stats.averageInTop2Stocks = mean(sum(stats.averageInTop2Stocks(1:2, :)));
stats.variance = (std(returns)*sqrt(252));
% Conversion of results to algorithm format
% cum_ret, cumprod_ret, daily_ret, daily_portfolio
daily_portfolio = portfolio;
daily_ret = returns+ 1;
cumprod_ret = cumprod(daily_ret);
cum_ret = cumprod_ret(end);
close(progress);
end
This template file essentially follows Protocol 1, as shown in the problem setting of OLPS. After having coded this strategy, the next task is to allow the toolbox to be able to read the Strategy details so that it can be run on several datasets, and be compared with others. This can be done in both the GUI mode and the PGUI mode.
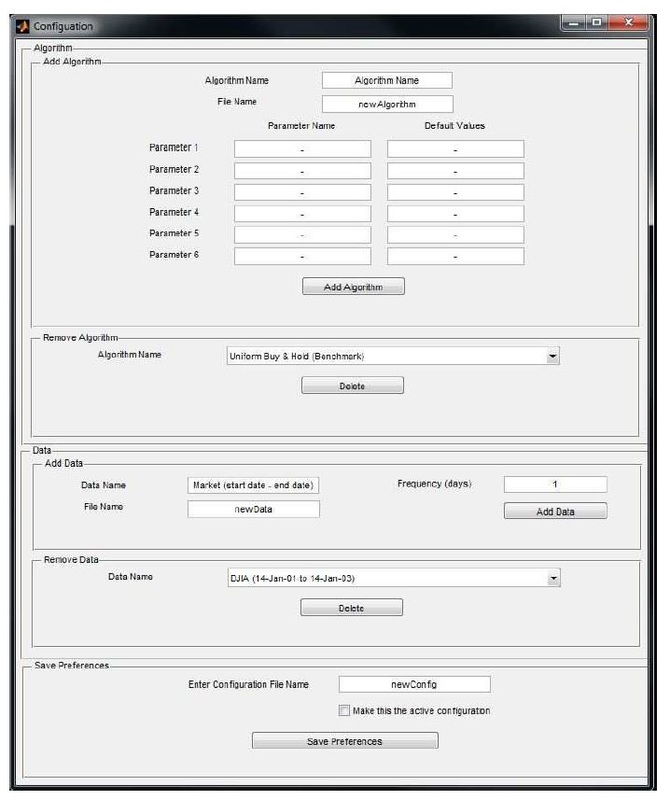
For the GUI mode, the configuration option can be used to enter the details of the algorithm. The name of the algorithm to be displayed in the toolbox, the file name containing the code, the parameter names, and their default values are required as input for the algorithm to be incorporated into the toolbox.
For the GUI mode, the configuration option can be used to enter the details of the algorithm. The name of the algorithm to be displayed in the toolbox, the file name containing the code, the parameter names, and their default values are required as input for the algorithm to be incorporated into the toolbox.
Alternately, users can add strategies using the PGUI. This however requires the creation of an additional config file for each strategy that is coded. A sample configuration file is provided in the toolbox "template_config.m". The config file for each algorithm essentially requires the same information the the GUI-configuration wanted. The menu-driven PGUI then offers straightforward functionality for the new strategy to be read by the toolbox.

